Quality of Life Scores in Patients with Low Visual and Factors Affecting them
Sheela Kerkar*
Department of Ophthalmology, Seth GS Medical College and KEM Hospital, Mumbai, India
- *Corresponding Author:
- Sheela Kerkar
Department of Ophthalmology,
Seth GS Medical College and KEM Hospital,
Mumbai,
India;
Email: mehtanehal104@gmail.com
Received: February 20, 2020, Manuscript No. IPJPM-23-3436; Editor assigned: February 25, 2020, PreQC No. IPJPM-23-3436 (PQ); Reviewed: March 10, 2020, QC No. IPJPM-23-3436; Revised: November 10, 2023, Manuscript No. IPJPM-23-3436 (R); Published: December 08, 2023, DOI: 10.36648/2572-5483.8.6.219
Citation: Kerkar S (2023) Quality of Life Scores in Patients with Low Visual and Factors Affecting Them. J Prev Med Vol.8 No.6:219.
Abstract
Background: Visual function is very important for optimal orientation in functional and social life, and has a great impact on physical and emotional well-being. Visual impairments have a negative impact on overall health related quality of life as noted in many previous studies.
Aim: To study the magnitude to which the quality of life of patients with low vision is affected. To study if there is a correlation between visual quality of life and age, gender, co morbidities and socio-economic status.
Settings and design: This study was conducted in tertiary care hospital at Ophthalmology department during 2018-2019. This was a cross sectional descriptive study of 733 patients, aged 12 and above with bilateral low vision (less than 6/18 on Snellen visual acuity test). In this study patient’s age, sex, visual acuity, visual quality of life, socioeconomic status and other parameters were recorded and analyzed.
Methods and materials: best corrected visual acuity was documented with the help of using a Snellen’s chart. Anterior and posterior segment evaluation was done to find cause of low vision. The researcher read out the questionnaire in the language that the participant can understand and filled it according to the participant’s responses. Once filled, the data was used for scoring and assessment based on guidelines given as per the National eye institute-visual function questionnaire 25 manual itself. Statistical tests were used to correlate the above data, including T test for two means, Chi-square test, and Pearson correlation coefficient to find the association between two variables. A p value of <0.05 was considered statistically significant.
Results: There is a strong negative correlation between mean score and category of visual disability. The study found a positive relation between education, per capita family incomes, and employment with visual function score.
Conclusion: Quality of life in relation to visual function is a product of multiple factors including but exclusively a result of visual acuity, colour vision, socio-economic and educational status.
Keywords
Quality of life; National Eye Institute-Visual Function Questionnaire (NEI VFQ-25); Visual impairment
Introduction
Humans are primarily visually motivated for survival and sight may in fact account for approximately 80% of the function of all the five senses combined [2]. Therefore, visual impairment causes restriction in all areas of life and in particular highly diminished quality of life. The leading causes of vision impairment are uncorrected refractive errors and cataracts. Almost 80% of all visual impairment in the world is considered as arising from avoidable causes. Estimates have shown that majority of people with vision impairment are above 50 years of age.
Globally, it is estimated that about 1.3 billion people live with some or the other form of vision impairment. The World Health Organization defines quality of life as “the individual’s perception of their position in life in the context of the culture and value system in which they live and in relation to their goals, standards, expectations, and concerns.” India was the first country to launch the National Programme for Control of Blindness (NPCB) in 1976, as a 100% centrally sponsored programme. Till few years ago, National Programme for Control of Blindness (NPCB) was a cataract centered programme. However, currently it is funding for management of many conditions including Diabetic Retinopathy (DR), glaucoma, ocular trauma, childhood blindness, keratoplasty, squint, low vision, Retinopathy of Prematurity (ROP) with its successful public private partrnerships.
Materials and Methods
The World Health Organization (WHO) estimates that there are 161 million visually impaired in the world, including 37 million blind, many of whom reside in less developed countries. Given the great size of population and prevalence of blindness in India, every fifth blind person lives in India resulting in an economic burden that a decade ago was estimated at $4.4 billion United States Dollars (USD) annually.
The World Health Organization (WHO) defines a person as blind if the best corrected visual acuity in the better eye is <20/400.
If a person has best corrected visual acuity <20/200 to 20/400, the visual disability is considered as Severe Visual Impairment (SVI) by WHO standards but still blind by Indian standard. Moderate Visual Impairment (MVI) is defined as the best corrected visual acuity between <20/60 and 20/200. the census 2011 collected information on eight types of disability (disability in seeing, in hearing, in speech, in movement, in mental retardation, in mental illness, any other and multiple disability) [1]. It revealed that 19% have disability in seeing. Also, among those visually disabled and non workers, 42.7% are dependents and 28% are students.
Visual impairment also causes drastic impact on daily life, including social activities and emotional functioning. Studies also note that loss of vision can cause depression, social isolation, and also falls and medication errors. However, visual acuity alone fails to capture the impact of vision disability. The national eye institute visual function questionnaire-25 (visual function questionnaire) was developed to measure self reported, visionrelated aspects of health status that are most significant to individuals with chronic eye disease. the reliability and validity of the visual function questionnaire-25 has been tested and confirmed on various group of patients with eye conditions, such as age related macular degeneration, glaucoma, cataract, viral retinitis, and diabetic retinopathy. the visual function questionnaire consists of 25 vision-targeted questions plus 1 overall health rating question. the questions fall into 11 visionspecific subscales: General vision, ocular pain, near activities, distance activities, social functioning, mental health, role difficulties, dependency, driving, colour vision, and peripheral vision. the questionnaire takes only ten minutes to complete. Visual quality of life questionnaires are more useful to assess the functional status of patients with visual handicap than general quality of life questionnaires, and can also assess the impact of low vision services provided to such patients. Data on prevalence, magnitude, causes of blindness and visual impairment and perceived quality of life among these patients are needed to better the existing preventive, medical and social rehabilitative and low visual aid services for these patients. This present study is an attempt to find out the visual quality of life perceived by patients with low vision in Mumbai and its association with age, gender, socioeconomic and educational standard.
Study design
This was a cross sectional descriptive study for determining the magnitude of visual function affected in patients with low vision. Factors like age, gender, education, occupation, comorbidities, social, economic factors were compared.
Inclusion criteria:
• Patients of both gender, and age above of 12 years.
• Patient whose visual acuity is less than 6/18 in both eyes.
• Patient or legally accepted representative willing to give
voluntary informed consent.
Exclusion criteria:
• Patients who are not able to complete the questionnaire.
• Any physical or mental illness, which in the opinion of the
investigator precludes.the inclusion of the participant.
• Low vision from treatable cause.
Subject recruitment plans and consent process
When the patient came to ophthalmology out patient department for routine ophthalmology examination after their screening has been done having best corrected visual acuity less than 6/18 in both eyes and if the patient fulfilled the inclusion criteria, he/she was approached and counselled about the study. Subjects who were willing to participate and sign the written informed consent, were enrolled in the study and their doubts were cleared regarding the study. Subjects for this study were ages 12 and above, who visited the out patient department of a tertiary care hospital in India. For routine ophthalmological examination, he/she was tested for visual acuity using Snellen’s chart. If the best corrected visual acuity of the patient was found to be less than 6/18 in both eyes, he/she was informed about the study and a consent form provided. Informed consents were obtained from each subject before enrollment. Detailed ocular and systemic history was taken. Details like age, gender, educational status, occupation, diagnosis, past history, history of known co-morbidities were also documented [2]. The visual function questionnaire (visual function questionnaire-25) was given to the patient on the same day in the language best understood by the patient.
Assessments
• Best corrected visual acuity was documented with the help of
using a Snellen’s chart
• (annexure 2) placed 6 meters away from the participant in a
well illuminated area. Near
• vision was also documented.
• Anterior segment evaluation was done using slit lamp, to look
for anterior segment
• conditions like corneal opacities, anterior uveitis, cataract.
• Intraocular pressure was measured for patients using
Goldmann applanation tonometer for patients with glaucoma.
• Posterior segment evaluation was done using direct and
indirect ophthalmoscopy.
• In cases that required optical coherence tomography for
diagnosis, it was done free of cost for the patient.
• The researcher read out the questionnaire in the language
that the participant can understand and filled it according to
the participant’s responses. Once filled, the data was used for
scoring and assessment based on guidelines given as per the
national eye institute-visual function questionnaire 25 manual
itself.
• To ease the implementation of the national eye institute visual
function questionnaire in the study, the questionnaire was
self-administered. Subscales, scored 0 to 100 (with 100
indicating highest function), were generated for overall health,
overall vision, difficulty with near vision activities, difficulty
with distance vision activities, limitations in social functioning
due to vision, role limitations due to vision, dependency due
to vision, mental health symptoms due to vision, future
expectations for vision, driving difficulties, limitations with
peripheral and color vision, and pain or discomfort in or around eyes. For analysis, when one or more items from a
subscale were missing, the subscale was considered missing.
Analyses using all available data (, a subscale score was
generated when the subject responded to one or more items
from the subscale) provided similar results [3].
Statistical analysis used
Continuous variables were presented as mean ± Standard Deviation (SD). The data obtained from visual function questionnaire were analyzed and compared in relation to age, gender, educational status, occupation and co-morbidities. Scores of the Visual function questionnaire were calculated as total scores as well as sub scores and presented as numbers and as range. Statistical tests were used to correlate the above data, including T test for two means, Chi square test, and Pearson correlation coefficient to find the association between two variables. A p value of <0.05 was considered statistically significant. The data was entered in and analysed using Microsoft excel. Statistical analysis was performed using the Microsoft Excel program.
Results
Age and gender
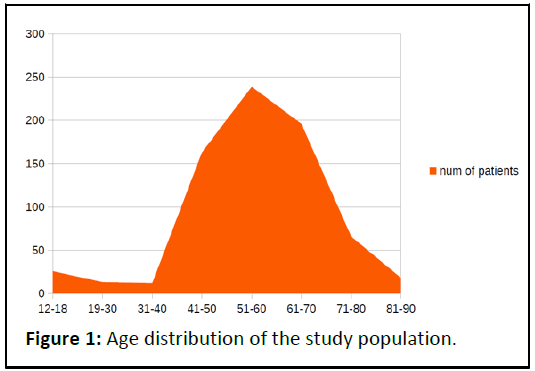
A total of 733 participants ages 12 years and above with bilateral visual acuity lower than 6/18 on Snellen visual acuity chart participated in the study. The mean age of participants was 56.38 ± 13.49 years (mean ± standard deviation) [4]. Minimum age of the participant recruited was 12 years and maximum age was 89 years. The participants were divided into 8 groups for data analysis according to age group 12 to 18 years, 19 to 30 years, 31 to 40 years, 41 to 50 years, 51 to 60 years, 61 to 70 years, 71 to 80 years, and 81 to 90 years (Table 1 and Figure 1).
| Age | Number of patients |
|---|---|
| 12-18 | 26 |
| 19-30 | 13 |
| 31-40 | 12 |
| 41-50 | 163 |
| 51-60 | 239 |
| 61-70 | 196 |
| 71-80 | 66 |
| 81-90 | 18 |
Table 1: Age distribution of the study population.
81.56% of the patients in study were between 41-70 years of age, among whom 32.60% of patients b elong to age group of 51-60 years, 26.73% being 61-70 years old, 22.23% patients were between 41-50 years old. It was found that maximum percentage of patients with low vision were in the age group of 51 to 60 years (32.60%) followed by age group of 61 to 70 years (22.23%) and the least in the age group of 31 to 40 years (1.63%).
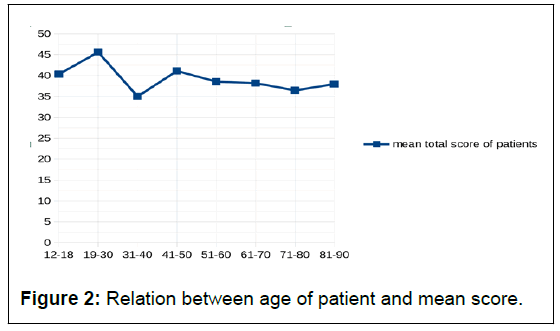
The relation between age of patient and mean score was a weak negative correlation, not statistically significant. (The P-value is 0.21. The result is not significant at p<0.05). 81.56%of the patients in study were between 41-70 years of age [5]. It was found that among this most common age group, most patients with better visual function scores were between age groups 41-50, followed by other age groups (Table 2 and Figure 2).
| Age | Mean total score | Standard deviation of score |
|---|---|---|
| 12-18 | 40.33 | 22.83 |
| 19-30 | 45.62 | 20.92 |
| 31-40 | 35 | 18.36 |
| 41-50 | 41.11 | 21.03 |
| 51-60 | 38.54 | 18.98 |
| 61-70 | 38.17 | 20.01 |
| 71-80 | 36.46 | 18.23 |
| 81-90 | 37.94 | 18.37 |
Table 2: Relation between age group and mean score.
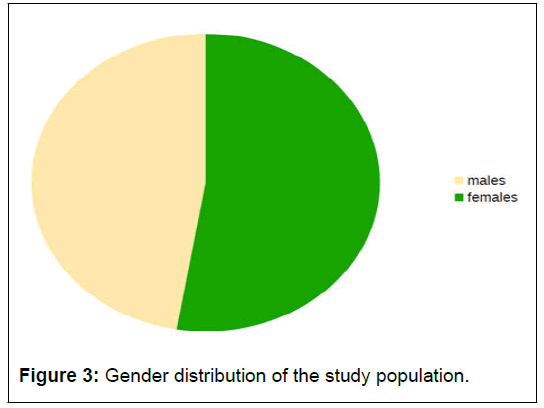
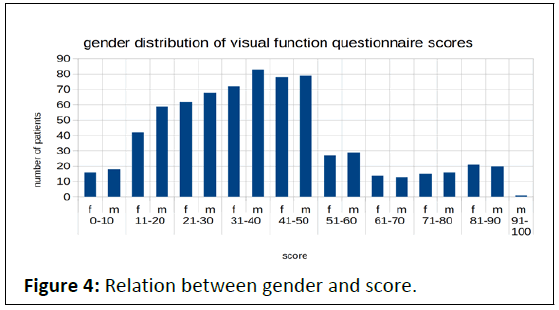
When the data was analyzed gender wise, there was a male: female ratio of 0.898:1. 347 patients were males and 386 were females. The percentage of male participants was 47.33% and that of female participants was 52.66% (Tables 3 and 4). There was a symmetric distribution in the scores on visual function questionnaire found among males and females (Figures 3 and 4).
There was no statistical difference between the scores of males and females, as the p-value is 0.12 (p<0.05).
| Gender | Number of patients | Percentage |
|---|---|---|
| Male | 347 | 47.34 |
| Female | 386 | 52.66 |
Table 3: Gender distribution of the study population.
| Comparison of scores of males and females | ||
|---|---|---|
| Gender | Mean total score | Standard deviation of score |
| Male | 38.95 | 19.8 |
| Female | 39.85 | 19.89 |
Table 4: Relation between gender and mean total score.
Visual acuity
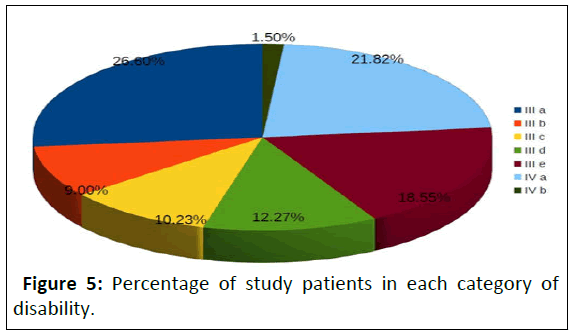
Patients with visual acuity lesser than 6/18 on Snellen visual acuity chart in both eyes were taken, thus belonging to category III a/b/c/d/e or IV a/b (low vision/blindness) as per disability affairs, government of India (Table 5 and Figure 5).
| Category | Num of patients |
|---|---|
| III a | 26.60% |
| Ill b | 9.00% |
| Ill c | 10.23% |
| III d | 12.27% |
| Ill e | 18.55% |
| IV a | 21.82% |
| IV b | 1.50% |
Table 5: Percentage of study patients in each category of disability.
1.50% of patients were 100% blind/category IV b/blind with bilateral visual acuity hand movement close to face or only perception of light or no light perception. 21.82% of patients were 90% blind/category IV a/blind with better eye visual acuity of less than 3/60 to 1/60 and worse eye less than 3/60 to No Light Perception [6]. 18.55% of patients were 80 % blind/ category III e/low vision with better eye visual acuity of Less than 6/60 to 3/60 and worse eye less than 3/60 to no light perception. 12.27% of patients were 70% blind/ category III d/low vision with better eye visual acuity of Less than 6/60 to 3/60 and worse eye Less than 6/60 to 3/60. 10.23% of patients were 60 % blind/category III c/low vision with better eye visual acuity of 6/24 to 6/60 and worse eye less than 3/60 to no light perception 9.00% of patients were 50% blind/category III b/low vision with better eye visual acuity of 6/24 to 6/60 and worse eye less than 6/60 to 3/60. 26.60% of patients were 40 % blind/ category III a/low vision with better eye visual acuity of 6/24 to 6/60 and worse eye 6/24 to 6/60.
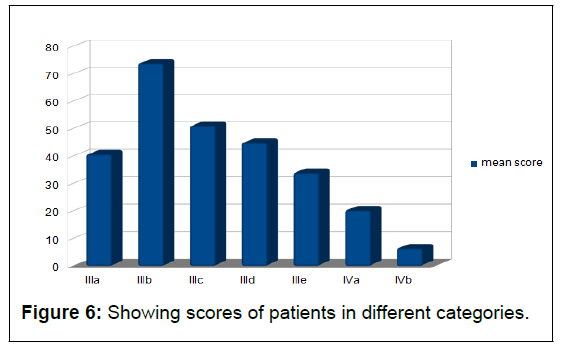
Although patients with better visual acuity were expected to have better scores than patients with lower visual acuity, there was a variation of scores within patients with the same category of low vision, indicating that factors other than visual acuity also played a role in quality of life for these patients (Table 6 and Figure 6).
| Category of visual disability |
Mean score | Standard deviation |
|---|---|---|
| III a | 40.61 | 20.43 |
| III b | 73.77 | 18.52 |
| III c | 50.98 | 9.26 |
| III d | 44.79 | 2.59 |
| III e | 33.89 | 4.69 |
| IV a | 20.21 | 7.31 |
| IV b | 6.34 | 1.15 |
Table 6: Comparing the visual score with disability category.
There is a strong negative correlation between mean score and category of visual disability. As expected, patients with lower visual acuity and higher categories of visual impairment had poorer final scores [7]. There were however some exceptions indicating other factors involved like social support, and use of rehabilitative services.
Relation of sub scale score to category of disability
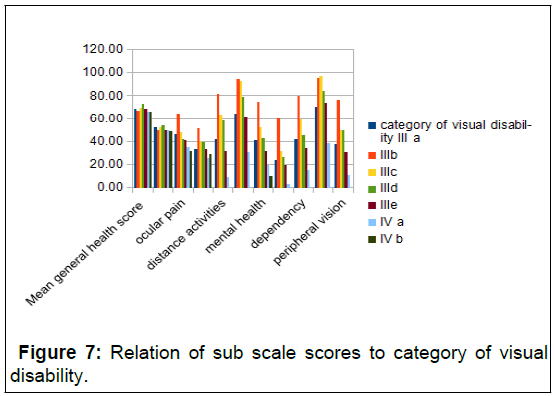
The following table shows the mean sub scale scores of patients with different categories to visual disability (Table 7 and Figure 7).
| category of visual disability | |||||||
| Mean subscale score | III a | III b | III c | III d | III e | IV a | IV b |
|---|---|---|---|---|---|---|---|
| Mean general health score | 68.59 | 67.05 | 69.67 | 72.78 | 68.57 | 66.41 | 65.91 |
| General vision | 52.21 | 49.7 | 52 | 53.78 | 49.85 | 49.63 | 49.09 |
| Ocular pain | 46.03 | 64.39 | 48 | 42.22 | 40.9 | 35.23 | 31.82 |
| Near activities | 32.99 | 51.26 | 39.78 | 39.63 | 33.52 | 25.1 | 28.79 |
| Distance activities | 41.79 | 81.31 | 63.33 | 58.33 | 31.5 | 8.85 | 0 |
| Social function | 63.97 | 94.32 | 92.5 | 79.17 | 61.21 | 31.02 | 0 |
| Mental health | 40.71 | 74.24 | 51.92 | 42.57 | 31.25 | 19.22 | 9.66 |
| Role difficulties | 24.17 | 59.85 | 31.83 | 26.39 | 19.21 | 2.89 | 0 |
| Dependency | 41.71 | 79.92 | 58.89 | 45.37 | 34.44 | 15.26 | 0 |
| Colour vision | 70.77 | 95.45 | 96.67 | 83.89 | 73.71 | 38.59 | 0 |
| Peripheral vision | 37.18 | 76.52 | 50 | 50 | 30.7 | 10.94 | 0 |
Table 7: Sub scale scores of patients in different categories of visual disability.
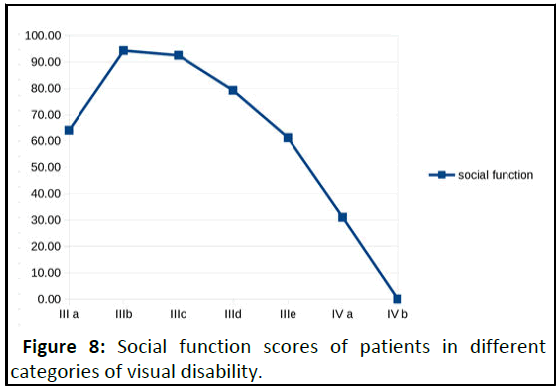
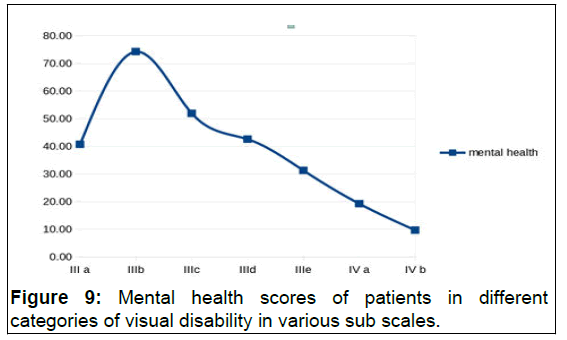
C Mean subscale scores were worse for patients in category IV a and IV b than those compared to categories III a, b, c, d, e (Table 8 and Figure 8). It was also noted that lower visual acuity had a significant impact on social function as shown in this graph [8]. Mental health scores were also extremely low in patients with lower visual acuity (Table 9 and Figure 9).
| Category of visual disability | Social function score |
|---|---|
| III a | 63.97 |
| III b | 94.32 |
| III c | 92.5 |
| III d | 79.17 |
| III e | 61.21 |
| IV a | 31.02 |
| IV b | 0 |
Table 8: Social function scores of patients in different categories of visual disability.
| Category of visual disability | Mental health score |
|---|---|
| III a | 40.71 |
| III b | 74.24 |
| III c | 51.92 |
| III d | 42.57 |
| III e | 31.25 |
| IV a | 19.22 |
| IV b | 9.66 |
Table 9: Mental health scores of patients in different categories of visual disability.
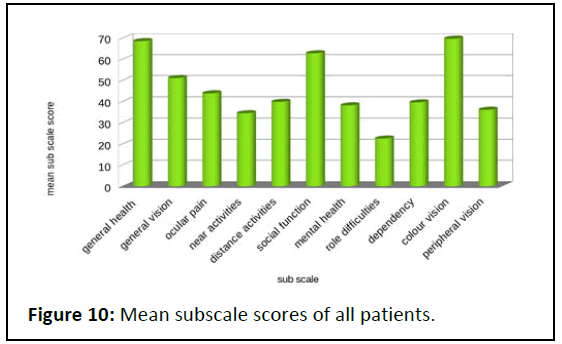
Mean scores the scores were found to be worse for role difficulties, near activities, peripheral vision and mental health (Table 10 and Figure 10).
| Sub-scale | Mean sub scale score | Standard deviation |
|---|---|---|
| General health | 68.55 | 30.31 |
| General vision | 51.1 | 20.6 |
| Ocular pain | 43.89 | 18.03 |
| Near activities | 34.45 | 21.4 |
| Distance activities | 39.85 | 30.1 |
| Social function | 62.82 | 30.64 |
| Mental health | 38.19 | 21.29 |
| Role difficulties | 22.51 | 20.79 |
| Dependency | 39.6 | 24.62 |
| Colour vision | 69.71 | 30.7 |
| Peripheral vision | 36.11 | 26.73 |
Table 10: Mean subscale scores of all patients.
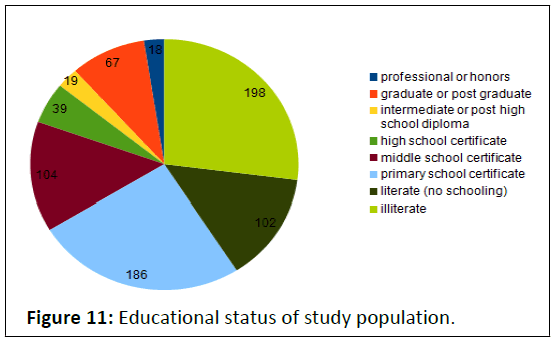
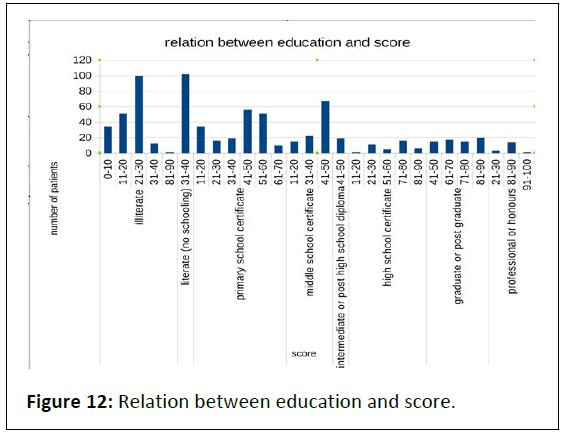
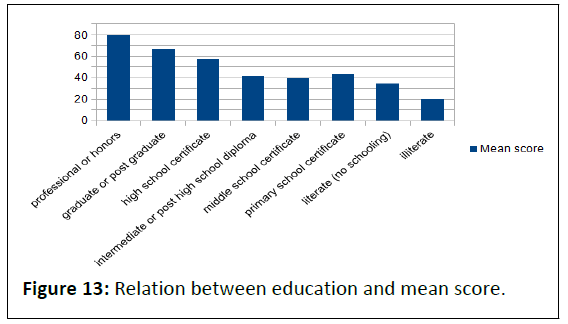
Educational status and visual function score 27.01% of patients surveyed were illiterate. 25.38% patients had primary school certificate, 14.19% had middle school certificate, 13.92% were literate but with no schooling, 9.14% were graduate or postgraduate, with 5.32% having high school certificate [9]. Intermediate or post high school diploma holders constituted only 2.59% of the participants (Table 12 and Figure 12).
Patients in different educational groups had different range of scores as shown in Table 12 and Figure 12.
| Educational status | Number of patients | Percentage |
|---|---|---|
| Professional or honors | 18 | 2.46 |
| Graduate or post graduate | 67 | 9.14 |
| Intermediate or post high school diploma | 19 | 2.59 |
| High school certificate | 39 | 5.32 |
| Middle school certificate | 104 | 14.19 |
| Primary school certificate | 186 | 25.38 |
| Literate (no schooling) | 102 | 13.92 |
| Illiterate | 198 | 27.01 |
Table 11: Educational status of study population.
| Education | Final score | Number of patients |
|---|---|---|
| Illiterate | 0-10 | 34 |
| 11-20 | 51 | |
| 21-30 | 100 | |
| 31-40 | 12 | |
| 81-90 | 1 | |
| Literate (no schooling) primary school certificate | 31-40 | 102 |
| 11-20 | 34 | |
| 21-30 | 16 | |
| 31-40 | 19 | |
| 41-50 | 56 | |
| 51-60 | 51 | |
| 61-70 | 10 | |
| Intermediate or post high school diploma |
41-50 | 19 |
| High school certificate | 11-20 | 1 |
| 21-30 | 11 | |
| 51-60 | 5 | |
| 71-80 | 16 | |
| 81-90 | 6 | |
| Graduate or post graduate | 41-50 | 15 |
| 61-70 | 17 | |
| 71-80 | 15 | |
| 81-90 | 20 | |
| Professional or honors | 21-30 | 3 |
| 81-90 | 14 | |
| 91-100 | 1 |
Table 12: Relation between education and score.
The study found a mostly positive relation between education and visual function score. Most patients with better education had better scores and those with lower or no education had poorer scores [10]. This may be due to better accessibility to low vision aids and knowledge of rehabilitative services available among the educated patients (Table 13 and Figure 13).
| Education | Mean score | Standard deviation |
|---|---|---|
| Professional or honors | 79.19 | 22.47 |
| Graduate or post graduate | 66.63 | 15.74 |
| HIGH school certificate | 57.69 | 27.5 |
| Intermediate or post high school diploma | 41.7 | 0.2 |
| Middle school certificate | 39.11 | 9.42 |
| Primary school certificate | 43.18 | 14.27 |
| Literate (no schooling) | 34.48 | 1.79 |
| Illiterate | 20.2 | 9.25 |
Table 13: Relation between education and mean score.
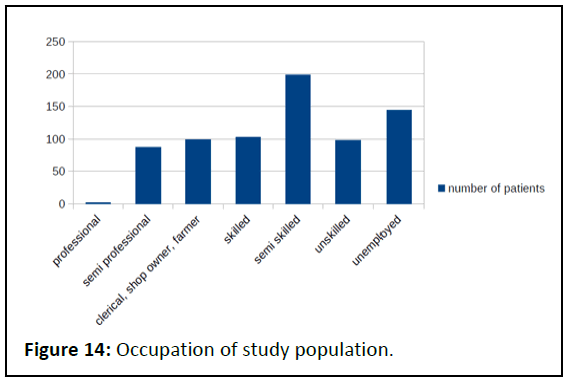
Correlation between education and mean score was statistically signi icant (P<0.5). Employment and per capita monthly family income. Table 14 shows distribution of the study patients according to their occupation [11]. Almost 20% of the study population was unemployed (Table 14 and Figure 14).
| Occupation | Number of patients |
|---|---|
| Unemployed | 144 |
| Semi skilled workers | 198 |
| Skilled workers | 103 |
| Unskilled workers | 98 |
| Clerical/Shop owners/Farmers | 99 |
| Semi professional | 87 |
| Professional | 2 |
Table 14: Occupation of study population.
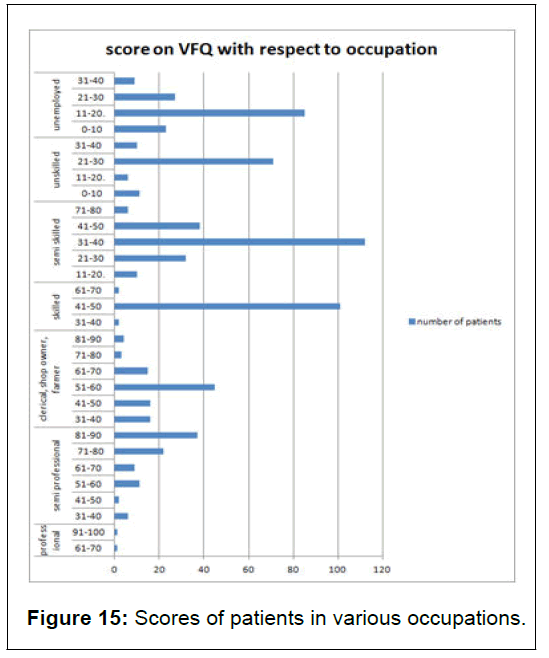
Patients who were unemployed had lower scores ranging from 0-40. 85 of the unemployed patients had a score between 11-20, 27 patients scored between 21-30, 23 patients between 0-10, and only 9 patients scored between 31-40. On the other end, two of the patients with professional employment had higher scores [12]. Semi professionals had scores between 31-90, with most of the patients (37 patients) having scores between 81-90 and least (2 patients) having 41-50.
As expected, patients with better employment opportunities, most probably tailored to their needs with regards to visual handicap, were likely to have better quality of life scores due to better inancial and social status, and it would also help at a psychological level [13]. The following table shows the relation of scores and number of patients in different occupations who had participated in the study (Table 15 and Figure 15).
| Occupation | Score | Number of patients |
|---|---|---|
| Unemployed | 0-10 | 23 |
| 11-20 | 85 | |
| 21-30 | 27 | |
| 31-40 | 9 | |
| Unskilled | 0-10 | 11 |
| 11-20 | 6 | |
| 21-30 | 71 | |
| 31-40 | 10 | |
| Semi skilled | 11-20 | 10 |
| 21-30 | 32 | |
| 31-40 | 112 | |
| 41-50 | 38 | |
| 71-80 | 6 | |
| Skilled | 31-40 | 2 |
| 41-50 | 101 | |
| 61-70 | 2 | |
| Clerical, shop owner, farmer | 31-40 | 16 |
| 41-50 | 16 | |
| 51-60 | 45 | |
| 61-70 | 15 | |
| 71-80 | 3 | |
| 81-90 | 4 | |
| Semi professional | 31-40 | 6 |
| 41-50 | 2 | |
| 51-60 | 11 | |
| 61-70 | 9 | |
| 71-80 | 22 | |
| 81-90 | 37 | |
| Professional | 61-70 | 1 |
| 91-100 | 1 |
Table 15: Scores of study participants in various occupations.
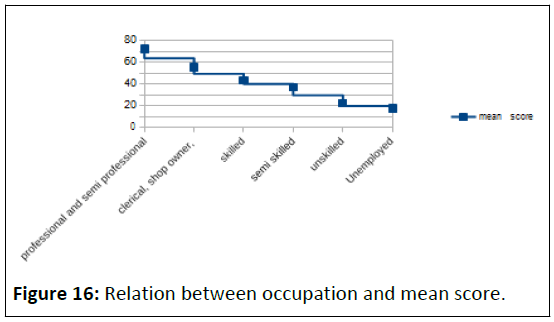
As shown in Table 16, it was found that there was a strong correlation between occupation and score (p<0.5). Patients with better occupational opportunities had better social, mental and inancial scores and lower dependency, while patients who were unemployed had worse inancial, emotional, social scores and greater dependency [14].
| Occupation | Mean score | Standard deviation |
|---|---|---|
| Professional and semi professional | 72.35 | 15.3 |
| Clerical, shop owner, | 55.64 | 11.86 |
| skilled | 43.4 | 3.37 |
| Semi skilled | 37.06 | 9.36 |
| Unskilled | 22.43 | 5.63 |
| Unemployed | 17.42 | 7.48 |
Table 16: Relation between occupation and score.
Capita income
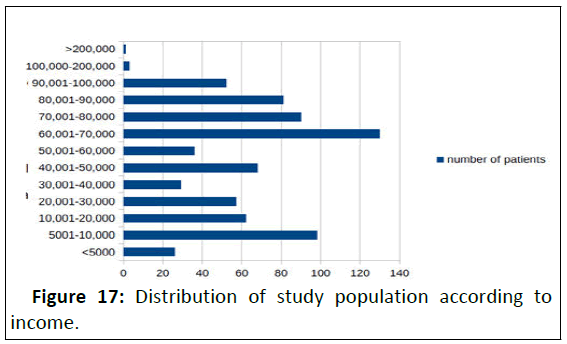
The number of participants in different groups of per capita income is as shown in the Table 17. 25.37% of the patients had per capita income lower than 20,000 per month (Figure 17).
| Per capita monthly family income in rupees | Number of patients |
|---|---|
| <5000 | 26 |
| 5001-10,000 | 98 |
| 10,001-20,000 | 62 |
| 20,001-30,000 | 57 |
| 30,001-40,000 | 29 |
| 40,001-50,000 | 68 |
| 50,001-60,000 | 36 |
| 60,001-70,000 | 130 |
| 70,001-80,000 | 90 |
| 80,001-90,000 | 81 |
| 90,001-100,000 | 52 |
| 100,000-200,000 | 3 |
| >200,000 | 1 |
Table 17: Distribution of study population according to income.
Relation of per capita income with score
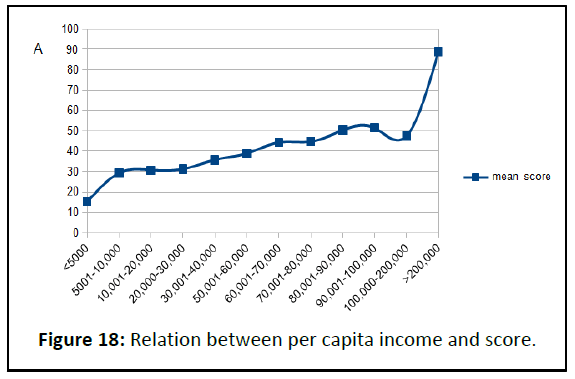
A statistically signi icant positive relation is noted between per capita income and score (signi icant at p<.05), indicating that patients with more inancial resources may also have better access to different rehabilitative services that others may not be able to afford. It was also noted however that in some cases better scores were seen in patients with lower incomes, and vice versa, which may result from other factors, such and social support and other co-morbidities (Table 18 and Figure 18).
| Per capita monthly income | Mean score | Standard deviation |
|---|---|---|
| <5000 | 15.12 | 12.92 |
| 5001-10,000 | 29.26 | 14.77 |
| 10,001-20,000 | 30.73 | 14.42 |
| 20,000-30,000 | 31.23 | 17.73 |
| 30,001-40,000 | 35.77 | 18.97 |
| 50,001-60,000 | 38.99 | 18.19 |
| 60,001-70,000 | 44.28 | 19.64 |
| 70,001-80,000 | 44.71 | 17.72 |
| 80,001-90,000 | 50.29 | 19.26 |
| 90,001-100,000 | 51.37 | 22.08 |
| 100,000-200,000 | 47.44 | 33.97 |
| >200,000 | 88.85 | 0 |
Table 18: Relation between per capita income and mean score.
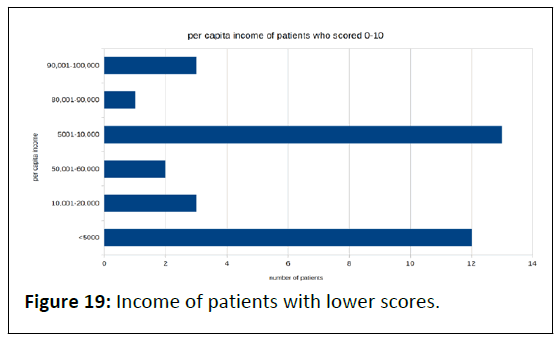
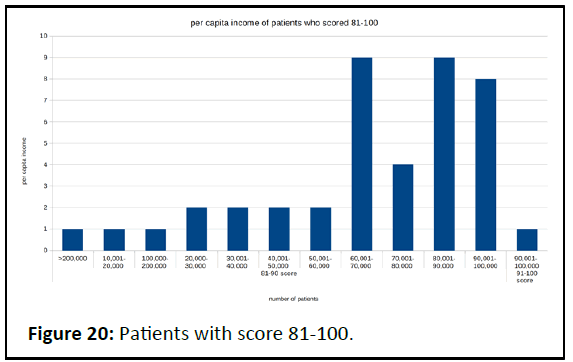
Positive relation is noted between per capita income and score, indicating that patients with more financial resources may also have better access to different rehabilitative services that others may not be able to afford (Table 19 and Figure 19). It was also noted however that in some cases better scores were seen in patients with lower incomes, and vice versa, which may result from other factors, such and social support and other comorbidities (Table 20 and Figure 20).
The following chart shows how patients with lower score belonged to the lower income groups, with 13 patients in 5001-10,000 income group, and 12 patients in <5000 group. The chart shows how patients who scored between 81-100 had higher incomes, with 9 patients in 80,001 to 90,000 group, 8 patients in 90,001 to 100,000 group (Figure 20).
| Per capita monthly family income in rupees | Number of patients with score between 0-10 |
|---|---|
| 90,001-100,000 | 3 |
| 80,001-90,000 | 1 |
| 50,001-60,000 | 2 |
| 10,001-20,000 | 3 |
| 5001-10,000 | 13 |
| <5000 | 12 |
Table 19: Patients with score 0-10.
| Per capita monthly family income in rupees | Number of patients with score 81-100 |
|---|---|
| 10,001-20,000 | 1 |
| 20,000-30,000 | 2 |
| 30,001-40,000 | 2 |
| 40,001-50,000 | 2 |
| 50,001-60,000 | 2 |
| 60,001-70,000 | 9 |
| 70,001-80,000 | 4 |
| 80,001-90,000 | 9 |
| 90,001-100,000 | 9 |
| 100,000-200,000 | 1 |
| >200,000 | 1 |
Table 20: Per capita income of patients with higher scores.
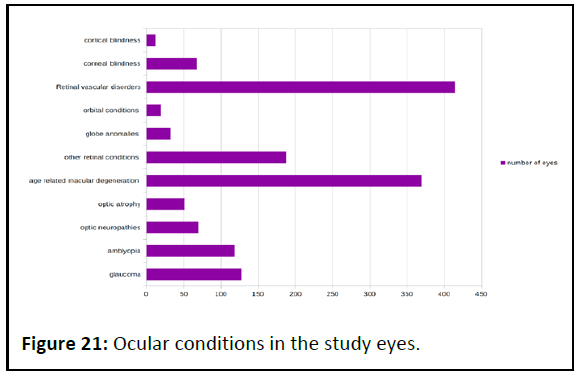
Ocular conditions causing low vision and blindness seen in the study. Out of the 1466 eyes (733 patients) studied, 414 had Retinal vascular disorders including diabetic retinopathy, hypertensive retinopathy, anterior ischaemic optic neuropathy, central retinal artery or vein occlusion, most common being diabetic retinopathy associated with complications such as maculopathy, retinal detachment, etc [15]. 380 eyes had diabetic retinopathy. 369 eyes had age related macular degeneration including CNVM complex.
188 eyes had other retinal conditions including chronic vitreous hemorrhage, retinal detachment, colobomas, Best, Stargardt’s, other maculopathies, myopic maculopathy, retinitis pigmetosa, pachychoroid disease spectrum, cystiod macular edema, sympathetic ophthalmitis, foveal hypoplasia, posterior uveitis 127 eyes were affected with glaucoma including congenital glaucoma (Table 21 and Figure 21).
| Condition | Number of eyes |
|---|---|
| Glaucoma including congenital glaucoma | 127 |
| Amblyopia | 118 |
| Optic neuropathies including primary and secondary | 69 |
| Optic atrophy including primary and secondary | 51 |
| Age related macular degeneration including CNVM complex |
369 |
| Other retinal conditions including chronic vitreous hemorrhage, retinal detachment, colobomas, Best, Stargardt’s, other maculopathies, myopic maculopathy, retinitis pigmetosa, pachychoroid disease spectrum, cystiod macular edema, sympathetic ophthalmitis, foveal hypoplasia, posterior uveitis | 188 |
| Globe anomalies like nanophthalmos, microphthalmos, pthysis, atrophic bulbi, eviscerated eye |
32 |
| Mucormycosis, other orbital conditions | 19 |
| Retinal vascular disorders including diabetic retinopathy, hypertensive retinopathy, anterior ischaemic optic neuropathy, central retinal artery or vein occlusion | 414 |
| Corneal conditions including trachoma, failed grafts, progressive degenerations, vitamin A deficiency and chemical injury induced corneal involvement | 67 |
| Cortical blindness | 12 |
| Total number of eyes | 1466 |
Table 21: Ocular conditions in the study population.
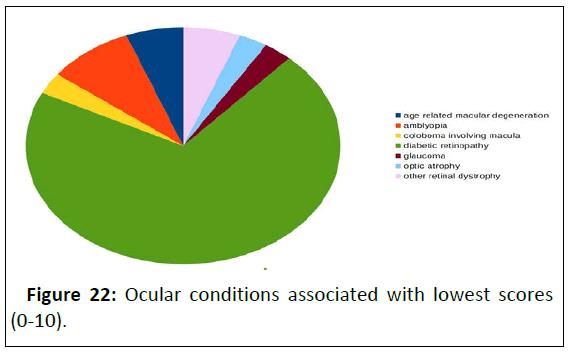
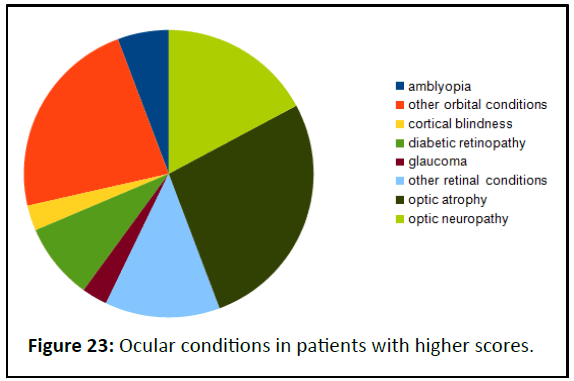
The following chart shows the distribution of various ocular conditions in patients who scored 0-10. Most of the eyes in this group had diabetic retinopathy (Table 22 and Figure 22). The following chart shows the distribution of ocular conditions among patients with higher scores (81-100) (Table 23 and Figure 23).
| Condition associated with low score(0-10) | Number of patients |
|---|---|
| Age related macular degeneration | 5 |
| Amblyopia | 6 |
| Coloboma involving macula | 1 |
| Diabetic retinopathy | 48 |
| Glaucoma | 2 |
| Optic atrophy | 2 |
| Other retinal dystrophy | 2 |
Table 22: Ocular conditions associated with lowest scores (0-10).
| Condition associated with high score(81-100) | Number of patients |
|---|---|
| Amblyopia | 4 |
| Other orbital conditions | 16 |
| Cortical blindness | 2 |
| Diabetic retinopathy | 6 |
| Glaucoma | 2 |
| Other retinal conditions | 9 |
| Optic atrophy | 19 |
| Optic neuropathy | 12 |
Table 23: Ocular conditions in patients with higher scores (81-100).
Comorbidities
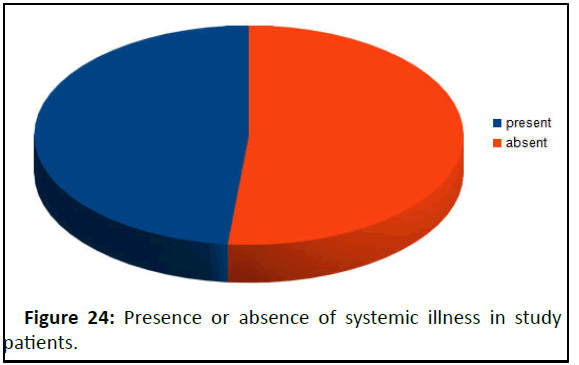
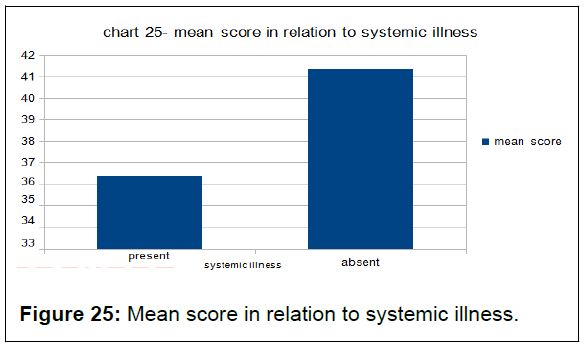
51.56% of patients in the study had no systemic illness. 33.01% patients had diabetes mellitus, with an additional 1.22% having uncontrolled diabetes with mucormycosis, 30.15% had hypertension and 0.27% had both diabetes and hypertension (Table 24 and Figure 24). 2.04% had active pulmonary tuberculosis under treatment, and 0.95% and 0.40% respectively had tuberculous meningitis and disseminated tuberculosis (Table 25 and Figure 25).
| Systemic history | Number of patients present |
|---|---|
| Present | 355 |
| Absent | 378 |
Table 24: Number of patients with and without systemic illness.
| Standard systemic illness | Mean score | Deviation |
|---|---|---|
| present | 36.39 | 23.01 |
| absent | 41.34 | 15.9 |
Table 25: Mean score in relation to systemic illness.
Patients with no systemic illness had greater mean score than those with systemic illness. There was a significant difference in the two groups at p<0.5 (p=0.015).
Discussion
Estimates on prevalence of blindness and low vision, age group and socioeconomic strata affected, and their impact on individuals and society are crucial to planning and delivering the necessary health and social services. It may affect various health policies. Screening helps in early detection of chronic vision threatening conditions and timely interventions are beneficial; in many cases preventing total blindness may be possible if not complete reversal of lost vision. Data from quality of life studies for patients with low vision are limited in our country. Patients and their care takers are often not aware of the low vision aids and social services available.
This study was conducted in tertiary care hospital at ophthalmology department during 2018-2019. This was a cross sectional descriptive study of 733 patients, aged 12 and above with bilateral low vision (less than 6/18 on Snellen visual acuity test). In this study patient’s age, gender, visual acuity, visual quality of life, socioeconomic status and other parameters were recorded and analyzed. It is discussed in details.
In this study, 347 patients were males (47.33%) and 386 were females (52.66%) as shown in table 3. There was no statistical difference between the scores of males and females as shown in Table 4. Clemons TE et al had conducted a study in Bethesda, United States, using the Visual Function Questionnaire and found that over 57% participants were females. A study conducted by Revicki DA, et al. in Bethesda had reported 59.3% participants as females. In another study by Rowe FJ, et al. in Liverpool, UK, the male and female participants percentage was 69% and 31% respectively.
81.56% of the patients in this study were between 41-70 years of age, among whom 32.60% of patients belong to age group of 51-60 years, 26.73% being 61-70 years old, 22.23% patients were between 41-50 years old as shown in Table 1. In a study conducted by age-related eye disease study research group, they found the median age of the population was 72 years (age range, 57-84 years) in their study. The mean age at baseline was 77 years (range, 53-97 years) in the study conducted by Chang TS, et al. in the United States. In yet another study conducted at LV Prasad Eye Institute, it was found that participants ranged in age from 18 to 88 years (mean ± SD=45 ± 17.9 years) and 79% were males. The range in these studies is similar to our study although median age of our study participants was lower, most probably due to inclusion of all conditions causing visual impairment including childhood blindness, whereas the above mentioned studied used diseases affecting older population like age related macular degeneration. A negative Correlation was found between age and mean total score as seen in Table 2. This may be due to better overall health related parameters of younger patients.
In this study, 1.50% of patients were 100% blind/in category IV b, 21.82% of patients were 90% blind/category IV a, 18.55% of patients were 80 % blind/category III e, 12.27 % of patients were 70% blind/category III d, 10.23% of patients were 60% blind/ category III c, 9.00% of patients were 50% blind/category III b, 26.60% of patients were 40% blind/category III a as shown in Table 5. There is a strong negative correlation between mean score and category of visual disability as seen in Table 6. This is expected, as patients with lower visual acuity will have lower visual quality of life scores. A study done in Africa by Ovenseri- Ogbomo GO, et al. showed similar results wherein 51.6% patients were classified as moderate visual impairment, 38.7% as severe, and 9.7% as profound visual impairment. Another study on low vision had reported a visual acuity of 6/18 to 6/60 in the better eye in 53.21% of participants, 6/60 to 2/60 in 30%, between 2/60 and Counting Fingers (CF) in 16.78% of patients.
As seen in Table 21, of the 1466 eyes studied, 414 had retinal vascular disorders including diabetic retinopathy, hypertensive retinopathy, anterior ischaemic optic neuropathy, central retinal artery or vein occlusion, most common being diabetic retinopathy associated with complications such as maculopathy, retinal detachment, etc, 369 eyes had age related macular degeneration including CNVM complex. 188 eyes had other retinal conditions including chronic vitreous hemorrhage, retinal detachment, colobomas, Best, Stargardt’s, other maculopathies, myopic maculopathy, retinitis pigmetosa, pachychoroid disease spectrum, cystiod macular edema, sympathetic ophthalmitis, foveal hypoplasia, posterior uveitis. 127 eyes were affected with glaucoma including congenital glaucoma.
Diabetic retinopathy affected almost 72% of the patients with lowest visual function scores (48 patients with score between 0-10) as seen in Table 22. In a similar article, development of the Ultra-Low Vision visual functioning questionnaire (ULV-visual function questionnaire), Baltimore, United States, it was found that age related macular degeneration, diabetic retinopathy, glaucoma, retinitis pigmentosa, other retinal dystrophy constitute the common conditions contributing to low vision and blindness.
In another study done with 280 patients in Saudi Arabia, it was found that that about eighty one patients were suffering from Optic atrophy which indicates that it is the main cause of low vision among the participating patients which makes up of 28.9% of the total patients. Retinitis pigmentosa was the second highest cause of prevalence of low vision, accounting for 73 patients that is 26% followed by Diabetic retinopathy and Macular degeneration which was found in 44 patients making up 15.7% and 16 patients making up 5.7% of the total population of the participants respectively.
The study found a positive relation between education and visual function score. This correlation between education and mean score was statistically significant (P<0.5), as seen in Table 13. Most patients with better education had better scores and those with lower or no education had poorer scores as shown in Table 12. This may be due to better accessibility to low vision aids and knowledge of rehabilitative services available among the educated patients. A population-based survey of 1136 subjects aged 40 years and older was conducted in a rural valley of Kentucky to determine the nature and extent of visual disability in an underserved area of rural America. In it, risk factor analysis revealed younger age, higher education, active employment, access to a health care facility, and comprehensive health insurance coverage to be inversely associated with visual impairment. Another study by Yip JL, et al. in the EPIC-Norfolk eye study, showed the association of visual impairment with education was statistically significant. In their study in the United States, Sharma S, et al. had noted qualitative and a quantitative reduction in health-related quality of life in persons with diabetic retinopathy.
Patients with better per capita family incomes had better sores than those with lower incomes, as seen in Table 18, which is likely due to better opportunities and access to certain low visual aid services that may not be available at cheaper rates or for free. However there were many in higher income groups who didn’t report high visual quality of life scores, indicating that there are other significant factors at play too. A similar study, titled Visual impairment and socioeconomic factors, also revealed that people who lived in the sample area Windsor which had the lowest median household income ($22 000) had twice the rate of visual impairment compared with overall sample rate of 1.34%. This observation also points toward the need for better social services and funding for low vision aids to help the financially backward patients.
A similar significant positive relation was found between nature of employment and score, seen in Table 16. Patients who were unemployed had lower scores ranging from 0-40. It is seen in table 15 that 85 of the unemployed patients had a score between 11-20, 27 patients scored between 21-30, 23 patients between 0-10, and only 9 patients scored between 31-40. On the other end, two of the patients with professional employment had higher scores. Semi professionals had scores between 31-90, with most of the patients (37 patients) having scores between 81-90, and least (2 patients) having 41-50. A German study by Nickels S, et al. showed similar findings.
355 of patients in the study had some systemic illness. 33.01% patients had diabetes Mellitus, 30.15% had hypertension. 2.04% had active pulmonary tuberculosis under treatment. Patients with no systemic illness had greater mean score than those with systemic illness. There was a significant difference in the two groups at p<0.5 (p=0.015) as seen in Table 25. Patients who had systemic illness like diabetes had poorer overall visual quality of life scores. In another German study, comorbidities and risk factors such as diabetes mellitus, hypertension, dyslipidemia, smoking, obesity and cardiovascular disease were found to have an impact on visual function. Participants in our study were referred to centers for low visual aids and other rehabilitative services.
In a study conducted In Eastern Regional Hospital, Koforidua, participants were given the visual function questionnaire before and after providing rehabilitative services like low vision aids. Respondents reported significant improvement in 8 of the 10 subscales. These were general vision, near vision, distance vision, peripheral vision, role difficulty, dependency, mental health and social function. No significant improvements in colour vision or ocular pains were reported, which is indicative of the fact that provision of Low vision devices does not markedly affect these domains. The most significant effect of low vision services was reported in the social function domain, which gives credence to the fact that, beyond mere visual functioning, there are other aspects of life of the low vision patient that are affected by low vision intervention.
The Montreal Barriers Study had found that individuals living independently were least likely to be referred and to accept low vision rehabilitation and that there are barriers other than lack of knowledge that keep people from seeking and obtaining appropriate services. Also, financial cost is not one of these obstacles.
In an Australian study, it was found that the major obstacles were lack of referral and/ or understanding of available services. Our study found that although all sub scale scores were affected, social function, role difficulties and dependency scores were most significantly affected in patients with low vision. A study by Mangione, et al. found similar impact on all sub scales.
Conclusion
The psychological, social and economic impact of low vision and blindness, especially in India has not been documented well enough in literature and need more research. The study found major changes in quality of life resulting from visual disturbance. In the present study, the number of female and male participants was almost similar with a male: female ratio of 0.898:1. Most patients were in age group of 51-60 years. This may indicate the common age group of presentation of conditions that cause low vision, such as age related macular degeneration, diabetic retinopathy, glaucoma, etc.
While patients with low vision and blindness were distributed in socioeconomic and educational backgrounds, visual function scores of 41-50 were most common scores across the groups. 19.64% of the study population was unemployed, and 40.38% were unskilled to semiskilled workers. While about 35% patients reported a lower perception of general health, it was found that over 50% patients reported dependency due to compromised visual function, 48.97% reporting lower mental health resulting from low vision, and over 20.80 patients had severe limitations in social functioning.
Patients with better economic status, education and higher occupations had significantly better visual function scores, which may indicate better availability of knowledge, access to low vision rehabilitative services. However the relations were not constant, which indicated interplay of other factors like comorbidities, role of care takers, presenting visual acuity. Visual acuity, while extremely important, cannot be used as a single measure to determine the impact of the visual condition on the patient. The study shows that there are various factors at play determining the visual quality of life, and better understanding the needs of visually disabled can help the healthcare provider give better quality of care. It is also worth noting that factors like social and mental function that are not assessed in the routine ophthalmology outpatient practice are in fact highly contributory to the patient’s lower quality of life.
Majority of these patients can benefit from the various low vision aids available, but aren’t aware of them. Thus recruitment of resources in the form of low vision aids, social services to aid patients find employment, and also psychological support by family and health care workers is of great aid in improving the quality of life of these patients. Furthermore, patients with low vision and their care takers should be explained and counselled regarding the nature of their condition and encouraged for use of low vision aids.
Ethical Considerations and Informed Consent
The study was conducted according to the principles stated in the declaration of Helsinki, 2013, ICH-GCP guidelines and ICMR’s ethical guidelines for biomedical research on human participants, 2017. Before initiating the study, the investigator obtained written and dated approval from IEC for the following documents: Study protocol/amendment(s), written informed consent document, case record forms, and protocol summary. During the study, any amendment or modification to the protocol was submitted to IEC and approval was sought. Periodic progress reports and study completion report were sent to IEC/ IRB. The investigator explained the benefits and risks of participation in the study to each participant to the fullest extent possible, along with the data confidentiality, the right to participation, no compensation as it is an observational study and done in routine course of time etc, in language and terms they are able to understand. Subsequently, a written informed consent prior to the initiation of the study was obtained from the participant/legally acceptable representative and impartial witness. Each original consent document was signed, dated and retained by the investigator.
Limitations of the Study
The study did not cover in depth various aspects of vision other that visual acuity, such as contrast sensitivity, visual field examination. The patients who were advised for low vision aids and social services were not followed up to survey the impact of low vision aids on visual function score. An improvement in visual function score is expected from use of these services, as shown in a similar studies.
References
- Nyman SR, Gosney MA, Victor CR (2010) Psychosocial impact of visual impairment in. Br J Ophthalmol 94: 1427-1431.
- Fricke TR, Tahhan N, Resnikoff S, Papas E, Burnett A, et al. (2018) Global prevalence of presbyopia and vision impairment from uncorrected presbyopia: Systematic review, meta-analysis, and modelling. Ophthalmology 125: 1492-1499.
[Crossref] [Google Scholar] [PubMed]
- Bekibele CO, Gureje O (2008) Impact of self-reported visual impairment on quality of life in the Ibadan study of ageing. Br J Ophthalmol 92: 612-625.
- Resnikoff S, Pascolini D, Etya'Ale D, Kocur I, Pararajasegaram R, et al. (2004) Global data on visual impairment in the year 2002. Bull World Health Organ 82: 844-851.
[Google Scholar] [PubMed]
- Shamanna BR, Dandona L, Rao GN (1998) Economic burden of blindness in India. Indian J Ophthalmol 46: 169-172.
[Google Scholar] [PubMed]
- Patil S, Gogate P, Vora S, Ainapure S, Hingane RN, et al. (2014) Prevalence, causes of blindness, visual impairment and cataract surgical services in Sindhudurg district on the western coastal strip of India. Indian J Ophthalmol 62: 240.
[Crossref] [Google Scholar] [PubMed]
- Lam BL, Christ SL, Lee DJ, Zheng DD, Arheart KL (2008) Reported visual impairment and risk of suicide: The 1986-1996 national health interview surveys. Arch Ophthalmol 126: 975-980.
[Crossref] [Google Scholar] [PubMed]
- Holden BA, Rao GN, Knox KM, Sulaiman SM (1997) Visual impairment: A correctable global problem. Med J Aust 167: 351-352.
[Crossref] [Google Scholar] [PubMed]
- West SK, Munoz B, Rubin GS, Schein OD, Bandeen-Roche K, et al. (1997) Function and visual impairment in a population-based study of older adults. The SEE project. Salisbury Eye Evaluation Invest Ophthalmol Vis Sci 38:72-82.
[Google Scholar] [PubMed]
- Rubin GS, Munoz B, Bandeen-Roche K, West SK (2000) Monocular versus binocular visual acuity as measures of vision impairment and predictors of visual disability. Investig Ophthalmol Vis Sci 41: 3327-3334.
[Google Scholar] [Pubmed]
- Scott IU, Smiddy WE, Schiffman J, Feuer WJ, Pappas CJ (1999) Quality of life of low-vision patients and the impact of low-vision services. Am J Ophthalmol 128:54-62.
[Crossref] [Google Scholar] [PubMed]
- Wang JJ, Mitchell P, Smith W, Cumming RG, Attebo K (1999) Impact of visual impairment on use of community support services by elderly persons: the Blue Mountains Eye Study. Investige Ophthalmol Vis Sci 40: 12-19.
[Google Scholar] [PubMed]
- Rovner BW, Zisselman PM, Shmuely‐Dulitzki Y (1996) Depression and disability in older people with impaired vision: A follow‐up study. J Am Geriatr Soc 44: 181-184.
[Crossref] [Google Scholar] [PubMed]
- Nutheti R, Shamanna BR, Nirmalan PK, Keeffe JE, Krishnaiah S, et al. (2006) Impact of impaired vision and eye disease on quality of life in Andhra Pradesh. Investigative Ophthalmol Vis Sci 47: 4742-4748.
[Crossref] [Google Scholar] [PubMed]
- Bourne RR, Flaxman SR, Braithwaite T, Cicinelli MV, Das A, et al. (2017) Magnitude, temporal trends and projections of the global prevalence of blindness and distance and near vision impairment: A systematic review and meta-analysis. Lancet Glob Health 5: 888-897.
[Crossref] [Google Scholar] [PubMed]
Open Access Journals
- Aquaculture & Veterinary Science
- Chemistry & Chemical Sciences
- Clinical Sciences
- Engineering
- General Science
- Genetics & Molecular Biology
- Health Care & Nursing
- Immunology & Microbiology
- Materials Science
- Mathematics & Physics
- Medical Sciences
- Neurology & Psychiatry
- Oncology & Cancer Science
- Pharmaceutical Sciences
