Theoretical Analysis of Blood Cell Concentration Oscillations Dynamics in Healthy Donors and Patients with Leukemia (in vivo)
AA Berezin and AV Shmid
DOI10.21767/2572-5483.100030
AA Berezin* and AV Shmid
EC-leasing, Moscow, Russian Federation
- *Corresponding Author:
- AA Berezin
EC-leasing, Moscow
Russian Federation
Tel: 717531-8181
Email: artparis@mail.ru
Received date: November 27, 2017; Accepted date: January 27, 2018; Published date: March 07, 2018
Citation: Berezin AA , Shmid AV (2018) Theoretical Analysis of Blood Cell Concentration Oscillations Dynamics in Healthy Donors and Patients with Leukemia (in vivo). J Prev Med. Vol.3 No.2:9
Abstract
A theoretical model has been proposed for acute leukemia developing mechanism (in vivo). The model describes the leukosis dynamics as an increase in the anomalous differentiation cycle energy of tumor blood cells (blasts) at the expense of the lymphocyte and segmented neutrophil cycle energy. The model has been formulated in terms of coupled Van der Pol equations with a time lag. The model solutions are in good agreement with experimental clinical data.
Keywords
Acute leukemia; Anomalous differentiation cycle; Hematopoietic organs; Parametric oscillations
Introduction
There are currently several theories of the leukemia development, such as the virus theory, virus-gene theory, clone theory, the theory of systemic development of this disease, etc. Leukemias are characterized by a systemic lesion of hematopoietic organs and a cyclic course of the disease. The theory, in which leukemia is treated as a systemic disease, holds that leukemia starts simultaneously throughout the entire hematopoietic system from the normal cells because of disturbances of the process of their differentiation (for example in some cases it triggers after a regular vaccination).
Materials and Methods
The research has been carried out in Hematological Department (Head professor Machonova LA) of the Oncological Research Center (director professor Blochin NN) by the cytologist professor Peterson IS The main purpose of the research was to simulate the process of sudden relapse happening in leukemic patients when the concentration of leukocytes could sharply increase from lower than 1000 cells per cubic mm to over 50000 cells during a day. Therefore, the simulation could possibly predict the relapse and help to modify the policy of chemotherapy in particular to reduce its toxicity to normal cells. Since such a sharp increase of cell concentration in case of relapse can be mathematically described within the dynamics or parametric oscillations, the authors addressed the existing studies of biological rhythms in the blood. The first researcher who described the oscillatory character of leukocyte concentration during a day was American scientist Franz Halberg [1]. He showed that leukocyte concentration in peripheral blood of healthy humans could change by 50% during a day. In cases of pathological states that variation maybe much larger. Authors could not find in scientific literature the blood cell concentration oscillations study. Accounting the Halberg results the authors decided to investigate circadian blood cell rhythms in healthy donors and in patients with acute leukemia. The results of the study [2,3] showed that the circadian blood cell rhythms in cases of leukemia had a broken phase of the cell concentration oscillations to compare with a stable phase of the same oscillations in the blood of healthy donors. The study of circadian blood rhythms in healthy mice and leukemic mice confirmed the phase breakage in the latter case [4]. The mentioned results allowed suggesting in clinic the right time of the leukemic blood rhythms phase correction through chemotherapy appropriate time administration and transfusion of donor neutrophils [3]. Together with that, the blood hour rhythms (in vitro) in healthy donors and patients with leukemia were studied [5]. All that allowed elaborating a theoretical model for description blood cell concentrations oscillatory dynamics in the blood of healthy donors and in that of leukemia patients.
Mathematical Model
Earlier [6], we proposed a physical model for the segmentedneutrophil and lymphocyte concentration oscillations (in vitro) in the blood of a healthy donor. We showed that these oscillations are described by coupled Van der Pol equations with a time lag:
 (1)
(1)
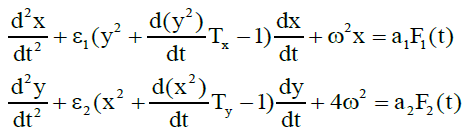
where x and y are derivatives of respectively segmented neutrophil and lymphocyte concentrations in the (in vitro) blood; Tx and Ty are the delay times between an action and a change in the concentrations, which are specified by the time of mutual differentiation of cells; ω <1 reflect the nonlinearity coefficients determined by the mechanism of protein synthesis by segmented neutrophils and lymphocytes;ω is the oscillation frequency of the derivatives of neutrophil and lymphocyte concentrations; F1(t),F2(t) are random functions which account for the influence of chaotic thermal fluctuations in the blood plasma electrolyte on the derivatives of x and y concentrations. System (1) was studied on a computer, and its solutions were shown to agree with the experimental results.
Furthermore, Ref. [6] showed that, along with the normal cells, the tumor (leukemic) ones were also present in the (in vitro) blood of acute-leukemia patients. Figure 1A present the plot of oscillations in the lymphocyte and leukemic-cell concentrations in the blood of a patient with acute lumphoblastic leukemia under {in vitro} conditions. The plots of the oscillations for a patient with myeloblastic leukemia are of the same character. In this case, however, the concentrations of segmented neutrophils and myeloblasts (tumor cells) oscillate in opposite phases. These experimental results allow one to propose a physical and mathematical model of both lymphoblastic and myeloblastic acute leukemias. In addition to the oscillation processes in the blood of healthy humans, described by system (1), the model also includes oscillations in the concentrations of leukemic (tumor) cells. Then, along with the aforementioned mutual differentiation of segmented neutrophils and lymphocytes (described by system (1)), mutual differentiation between lymphocytes and lymphoblasts shows up in the (in vitro) blood [5]. Mathematically, mutual differentiation between lymphocytes and lymphoblasts is expressed by the equations
 (2)
(2)

Figure 1A: (left) Hourly oscillations in the concentrations of (L)(ÃÆÃÂÃâââ¬Âº) lymphocytes and (TC).
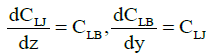
where CB and CB are absolute concentrations of lymphocytes and lymphoblasts, respectively, and z is the derivative of the concentration of the protein synthesized by the lymphoblasts in the blood. In this case, the equation
 (3)
(3)
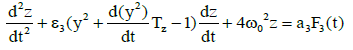
Which describes the dynamics of the rate of protein concentration variations, should be added to system (2). As it is known normal lymphocytes synthesize immunoglobulins and lymphoblasts synthesize specific proteins. Here z is the derivative of the concentration of the proteins synthesized by lymphoblasts in the blood, Tz is the time of the lymphocyte differentiation to the lymphoblasts. Such type of differentiation was found by cytologist Peterson I.S. in the process of periodical blood analysis of the thermostatic blood (in vitro). This study [7] showed the existence of both processes – differentiation of blood cells and dedifferentiation of them [7] lymphocytes into lymphoblasts and opposite direction of differentiation. Such process occurs only in relatively large amounts of incubated blood like 150–200 ml. Moreover, the study in these conditions leukemic blood (both lymphoblastic and myeloblastic leukemias) demonstrated the opposite direction of differentiation but at an early stage of malignization, as it was found by cytologist Peterson I.S. F3(t) is a random function which accounts for the influence of chaotic thermal fluctuations in the blood plasma electrolyte on the rate of protein diffusion into the lymphoblasts and lymphocytes, and ω0 represents the frequency of (in vitro) cell free oscillations corresponding to the oscillation period 2π/ ω0 =2 h 40 min found experimentally [5]. With regard to (2), the equation describing the concentration variation rate for the lymphocyte-synthesized proteins will have the form
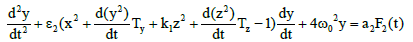 (4)
(4)
(OK) leukemic cells in the blood of a patient with acute lymphoblastic leukemia (in vitro) Horiz.axis days, Vert axis thousands of cells per 1 cubic millimeter.
Figure 1B shows the numerical solutions of coupled Equations (1-4). Substitution of the x, y, and z values into the equations for absolute concentrations yields the curves which are consistent with the experimental data.

Figure 1B: (right) Results of the mathematical simulation of hourly oscillations in the derivatives of X neutrophil, y lymphocyte, and z leukemic-cell concentrations (in vitro). Horz. axis days, Vert. axis thousands of cells per 1 cubic millimeter.
As the delay time Tz decreases by a factor of 3, the model solutions show a fall of the lymphocyte absolute concentration and a rise of the lymphoblast absolute concentration. This suggests the conclusion that the leukemic process is the increase of the leukemic-cell differentiation cycle energy. The tumor cells have a differentiation cycle of their own with parameters different from those of the healthy-cell differentiation. In some instances, this difference gives rise to an autoparametric excitation of the amplitude of tumor cell concentration oscillations and the tumor differentiation of cells in the buffer organs: bone marrow, spleen, and lymph nodes. To put it differently, the initiation and development of the leukemic process is the excitation of selfoscillations with time parameters different from those of selfoscillations of the healthy-blood cell differentiation and, hence, insults in the energy take-off by the tumor cycle.
leukemic-cell differentiation cycle energy. The tumor cells have a differentiation cycle of their own with parameters different from those of the healthy-cell differentiation. In some instances, this difference gives rise to an autoparametric excitation of the amplitude of tumor cell concentration oscillations and the tumor differentiation of cells in the buffer organs: bone marrow, spleen, and lymph nodes. To put it differently, the initiation and development of the leukemic process is the excitation of selfoscillations with time parameters different from those of selfoscillations of the healthy-blood cell differentiation and, hence, insults in the energy take-off by the tumor cycle.
The experimentally observed synchronism in the oscillations of segmented-neutrophil and lymphocyte absolute concentrations throughout the entire volume of the (in vitro) blood under study is a phenomenon similar to the formation of Benard cells, synchronous contractions of the heart muscle, Belousov- Zhabotinsky reaction, etc. At the same time, the synchronization mechanism for blood cell concentration oscillations (in vitro) requires the assumption of the existence of a medium with properties inherent in a continuous dynamical system. The role of such a medium can be played by the strong blood plasma electrolyte treated as dense physical plasma.
The previously developed mathematical model of oscillations in the concentrations of segmented neutrophils, lymphocytes and tumor cells in the (in vitro) blood is used as a basis for the model of oscillations of the aforementioned concentrations (in vivo).
Mathematical model of daily and hourly oscillations in the segmented neutrophil, lymphocyte and leukemic cell concentrations (in vivo). The experimental data obtained and the results of mathematical simulation of (in vitro) oscillations of segmented neutrophils, lymphocytes, and leukemic cells allowed developing a mathematical model to describe the daily and hourly oscillations in the concentrations of these cells (in vivo). The basic system of equations has the form:
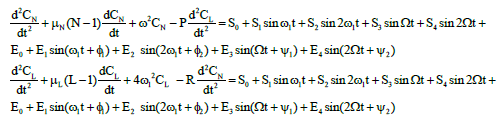 (5)
(5)
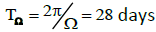
Where N is segmented-neutrophil concentration in the bone marrow and L is lymphocyte concentration in the lymph nodes (both normalized to the statistically averaged concentrations for a given age group). CN and CL are the departures of respectively the segmented-neutrophil and lymphocyte concentrations from their averaged values in the peripheral blood. The righthand sides of Eqs (5) describe the external action of the daily and monthly variations in the cosmic ray intensity and of earth magnetic field  and
and being initial amplitudes of these agents.
 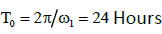 ,
, 
 are the phase shifts equal to 4 and 2 hours,
  are the phase shifts equal to 4 and 2 days,
 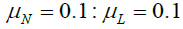 and are the coupling coefficients.
 (6)
(6)
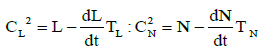
These two equations reflect the lagging influence of the dampers of neutrophil and lymphocyte concentration oscillation amplitudes due to the damping effect of the bone marrow (for CL ) and the lymph nodes and spleen (for CL ). The delay time TN is
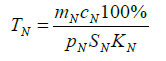 (7)
(7)
Where cN is the bone marrow volume, cN is the specific rate of neutrophil absorption from the peripheral blood by the bone marrow, pN is the surface area of the bone marrow, pN is the neutrophil percentage in the bone marrow and KN is the specific rate of the neutrophil outflow from the bone marrow to the peripheral blood proportional to the rate of the bone marrow myeloblast differentiation to the neutrophil stage, and
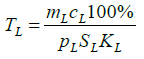 (8)
(8)
where cL is the spleen and lymph node volume, cL is the specific rate of the lymphocyte absorption from the peripheral blood by the spleen and lymph nodes, SL is the lymphocyte percentage in the spleen and lymph nodes, SL is the surface area of the spleen and lymph nodes, and KL is the specific rate of the lymphocyte outflow to the peripheral blood is proportional to the rate of the lymphoblast differentiation in the spleen and lymph nodes to the lymphocyte stage.
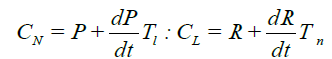 (9)
(9)
Here, P is the myeloblast concentration in the spleen and lymph nodes and R is the lymphocyte concentration in the bone marrow. Two Equations (9) Describe the mutual synchronization of oscillations in the cLand cLconcentrations due to the neutrophil differentiation from the myeloblasts in the spleen and lymph nodes and the lymphocyte differentiation from the lymphoblasts in the bone marrow. Then
 (10)
(10)
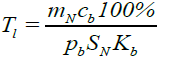
where cb is the specific rate of lymphocyte absorption from the peripheral blood by the bone marrow, Kb is the lymphocyte percentage in the bone marrow and Kb is the specific rate of the lymphocyte outflow to the peripheral blood from the bone marrow proportional to the rate of the bone marrow lymphoblast differentiation to the lymphocyte stage. The delay time n T (equal to the time of this differentiation) is
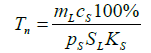 (11)
(11)
Where pS is the specific rate neutrophil absorption from the peripheral blood by the spleen and lymph nodes pS is the neutrophil percentage in the spleen and lymph nodes and KS is the specific rate of the neutrophil outflow to the peripheral blood proportional to the rate of the lymphoblast differentiation in the spleen and lymph nodes to the neutrophil stage.
Depending on the delay times TN ,TL,Tx,Ty the systems described by the Van der Pol equations with a time lag were shown to have different oscillation modes [9]. So, synchronous stable oscillations with period T0 were observed for 
 oscillations switch abruptly from the in-phase to the antiphase mode. The in-phase mode of daily oscillations in the segmented-neutrophil and lymphocyte concentrations is observed (as shown in Figures 1A and 1B in Ref. [6]) in healthy humans and animals (mice), while the antiphase one is observed in patients with infectious and inflammatory diseases (Figure 3 in Reference [6]).
Computer analysis of the joint solution of system (5, 6, 9) and system (4) of Reference [6] showed both qualitative and quantitative agreement of the mathematical model with the experimental data for healthy donors (Figure 2) and patients with infectious diseases (Figure 3) and the development of acute leukemia (Figure 4). In addition, we studied the model solutions for an impulse action on the system (which models e.g., vaccination and the effects of various chemical and other stressor agents on the blood). If the blood was affected at the time instant corresponding to the inflection point of the function describing the concentration variation for the lymphocyte-lymphoblast differentiation cycle, we found a high probability of leukemia development (that is, an autoparametric excitation of this normally very small cycle, and a predominant redifferentiation of buffer organ cells to lymphoblasts). Sometimes this is actually observed upon vaccinations and chemical poisoning. In order to simulate this kind of effects, an impulse action (shown by the arrow in Figure 1B) was exerted on the model within the time interval in which the regular antiphase oscillations develop in the model solutions. As is evident from the plots obtained (Figure 1B), the oscillation character changes drastically upon an impulse action. In particular, a violation of the phase and amplitude stability is observed. In addition, both the experimental system and its mathematical model possess "memory" with respect to external influences, which is also a characteristic feature of open thermodynamic systems.

Figure 2: Computer simulation of the daily and hourly oscillations of (1) neutrophil and (2) lymphocyte concentrations in the blood of healthy donors. Horiz. axis – days, Vert. axis - thousands of cells per 1 cubic millimeter

Figure 3: Computer simulation of the daily oscillations of (1) neutrophil and (2) lymphocyte concentrations in the blood of a patient with an inflammatory disease. Horiz. axis – days, Vert axis - thousands of cells per 1 cubic millimeter.

Figure 4: Computer simulation of the daily oscillations in (1) neutrophil, (2) lymphocyte, and (3) lymphoblast concentrations in the blood of a patient with acute lymphoblastic leukemia.
These studies of the model also showed that the introductions of additional buffers (e.g., segmented neutrophils from a donor) into the blood are among simple effective methods to affect a leukemic process so that the leukemic cells redifferentiate to lymphocytes. The introduction results in a rapid decrease in the amplitude of the leukemic cycle of the differentiation. This method was clinically tested and proved to be highly effective.
Now consider the reasons for the change in the blood cell differentiation cycle parameters. We believe that the delay times TN ,TL,Tx,Ty are genetically determined and affected by various changes in a DNA molecule. These changes, as a consequence, violate the amplitudes and phases of daily oscillations in the concentrations of these types of leukocytes. In fact, the reasons for the change in the differentiation cycle parameters lie at a micro level; namely, in the changes of the parameters of the vibrational dynamics of a DNA molecule. The latter changes can be produced, e.g., by an incorporation of viruses that affect the molecular structure. Moreover, owing to a number of genetic differences in the inbred mice of the AKM strain, the differentiation delay periods can change at a level of the characteristic differences between the DNA molecule of these mice and e.g., the statistically averaged DNA molecule of mongrel mice. It is these differences that lead to inborn changes in the experimentally observed (see Figure 2 in [6]) daily oscillations in the segmented-neutrophil and lymphocyte concentrations.
Results
Thus, on the basis of mathematical simulation of the hematopoietic system both (in vitro) and (in vivo) and comparison between the results of simulation and experimental data, one may conclude that the blood system is an open thermodynamic system with a number of attractor cycles of the differentiation with genetically determined cycle parameters. In view of various genetic disturbances and inborn differences in the DNA molecule structure, the cycle parameters can change either spontaneously or under external factors. The presence of two small (lymphoblastic and myeloblastic) cycles in such an open thermodynamic system, the blood, is always observed in healthy humans. As it was shown by the computer study of the model an autoparametric excitation of one of these cycles and the development of lymphoblastic and myeloblastic leukemias as well as the relapse of the disease (for the possible aforementioned reasons) represent a typical physical scenario of quick energy transfer between the cycles.
Numerical analysis of the model was followed by clinical studies aimed at a redistribution of the cell cycle energy with the aid of segmented-neutrophil suspension and traditional cytostatics. A preliminary scenario of the treatment was first worked up using computer model in order to determine the optimum point in time to affect the blood system. Despite an obvious complexity of this method, (it needs up to 8 blood samplings a day), the leukemic process disappeared completely in some cases. The utmost difficulty lies in the «lucky» coincidence between the model dynamics and the dynamics of the oscillation processes in the blood of a particular patient with acute leukemia. Furthermore, the symptoms of allergic diseases (manifested over a long period of time) were found to disappear upon medical treatment with intravenous neutrophil suspension injection.
Conclusion
Based on the results of clinical studies and mathematical simulations, we can formulate the following conclusions:
- in treatment of acute leukemic patients, the chemotherapy courses should be administrated at a certain time of day because the temporal variation in the cell sensitivity to cytostatics in an organism is of oscillatory character (similar to the blood cell concentration oscillations). Specifically, in continuous drop infusion of chemotherapy drugs during a day, their concentration should normally approach its minimum and maximum values within the time intervals from 6 a.m. to 8 a.m. and from 6 p.m. to 8 p.m., respectively. The maximum and minimum drug concentrations should differ by not less than an order of magnitude. Similar recommendations hold true for onetime infusions.
- it is recommended that traditional of vaccinations children be made within the period from 2 p.m. to 6 p. m. and not less than one month before or after the birthday of a child.
- Contact with strong chemicals should be avoided from 2 a.m. to 12 a.m.
- other pathological processes such as autoimmune diseases (bronchial asthma), some kinds of tumors, as well as the dynamics of a number of viral diseases can be described similarly to the above model. The approach given above was elaborated for improving the treatment policy whereas general theoretical model was carried out for general description of leukemia origin [5]. In blessed memory of Lenochka Berezina, who died at 20 of leukemia.
References
- Halberg F, Cornélissen G, Katinas G, Syutkina EV, Sothern RB, et al. (2003) Transdisciplinary unifying implications of circadian findings in the 1950s. J Circadian Rhythms 1: 2.
- Makhonova LA, Peterson IS, Mayakova SA, Berezin AA (1979) Study of circadian rhythms in peripheral blood of children with acute leukemia. Pediatrics 8: 16.
- Makhonova LA, Buachidze LN, Mayakova SA, Berezin AA (1979) Neutrophils transfusion in children with acute leukemia for correction of circadian rhythms in peripheral blood. Pediatrics 12: 1-5.
- Pavlova LA, Kharkovskaya NA, Khrustalev SA, Berezin AA (1982) Circadian blood rhythms changes in experimental leukemia. J Hematol Blood Transfus 2: 23.
- Berezin AA (1980) Blood cell concentration oscillations in vitro in the blood of healthy donors and in the blood of patients with leukemia. Proceedings of the First Ukrainian conference of hematologists and Transfusiologists pp: 92.
- Berezin AA, Shcheglov VA (2002) Short messages in physics of LPI bulletin of the lebedev physics Institute. B Lebedev Phys Inst 4: 1.
- Berezin AA, Pasta F (2017) Ulam recurrence and coupled discrete ginzburg-landau chains in the description of various In Vitro states of cell differentiation in the blood of healthy donors and acute leukemia patients. Health Educ Care 2: 4.
- Fok MV (1999) Brief Communications on Physics of LPI. B Lebedev Phys Inst Edn 4th pp: 25.
- Rubanik VP (1969) Oscillations of quasilinear systems with time lag nauka. pp: 288.

Open Access Journals
- Aquaculture & Veterinary Science
- Chemistry & Chemical Sciences
- Clinical Sciences
- Engineering
- General Science
- Genetics & Molecular Biology
- Health Care & Nursing
- Immunology & Microbiology
- Materials Science
- Mathematics & Physics
- Medical Sciences
- Neurology & Psychiatry
- Oncology & Cancer Science
- Pharmaceutical Sciences